Crash Course on GTmetrix
So what is GTmetrix? According to Google’s own AI, “GTmetrix is a free website performance and speed testing tool that analyzes a site’s loading speed and provides detailed reports with recommendations for improvement.” I’ve been using it for about 13 years now and even pay for a subscription. When you host hundreds of websites, you wind up testing load times regularly.
The good news is that if you’re not a web developer and you only have one website, you can run GTmetrix a few times per day for free. So let’s dive into what these tests actually tell us.
Comparing a Fast Site to a Slow One
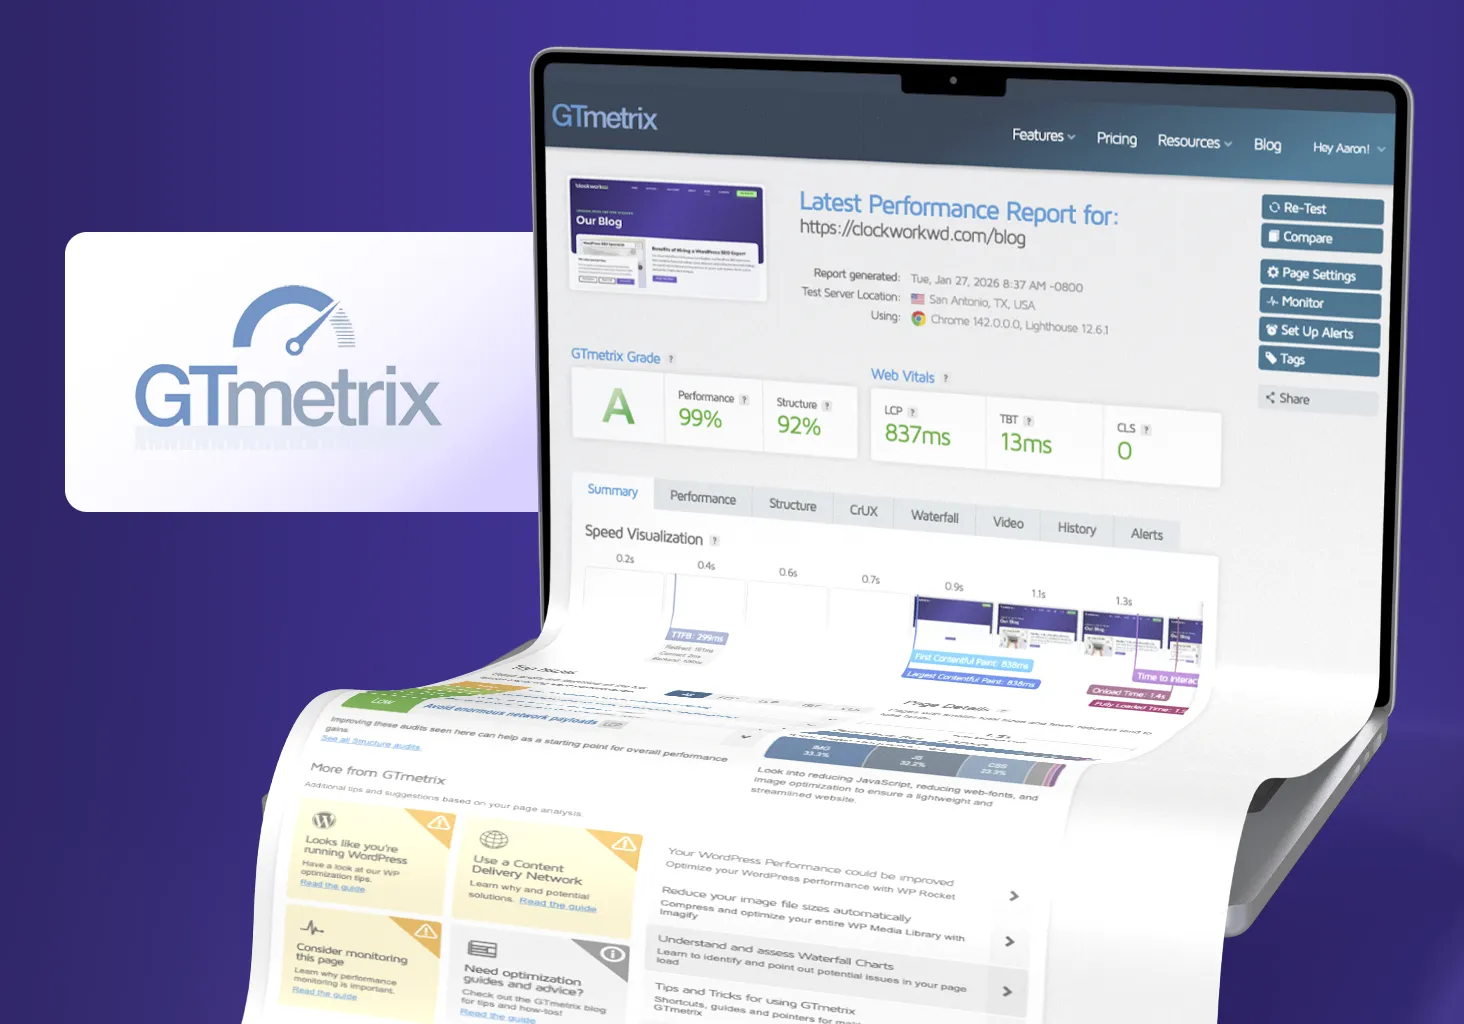
If you look at a GTmetrix report for Clockwork, the results are excellent. Pages load fast, the total page size is reasonable, and there aren’t many red flags. Compare that to a slower site, and GTmetrix almost always highlights the same handful of issues.
Any significant problems show up under Top Issues. Understanding what these results mean matters more than getting a perfect score – some “issues” won’t affect your users while others might be critical. Here is a screenshot from our fully optimized site, and another that is not:


There’s a dramatic difference between how these sites perform. It’s the same few issues that drag down most sites, and network payload is typically the biggest offender. Site speed affects search rankings too, so we also look for these performance problems during SEO audits.
Network Payloads: Too Much Stuff
“Network payload” is just a technical way of saying how much data your website asks a visitor’s browser to download before the page finishes loading. This includes images, fonts, JavaScript files, CSS files, embedded media, and third-party scripts like analytics, chat widgets, or ads.
Fast sites limit what they load. The best strategy is to compress images (preferably WEBP or AVIF), minimize JavaScript, and skip loading unnecessary files upfront. Slow sites hand the browser far too much, far too quickly, and tend to hobble site performance.
GTmetrix flags when the page size grows too large or when you use jumbo file sizes when leaner files would work. Unoptimized fonts or plugins that load content on every page (whether they’re needed or not) can also hurt site performance. You want web design solutions that plan for these factors from the start to keep payload sizes under control.
JavaScript: Power With a Cost
- Large script bundles
- Render-blocking scripts
- Multiple libraries doing similar jobs
- Third-party scripts loading on every page
When the Browser Gets Bogged Down
Even if you optimize images, minimize JavaScript, and set up your page builder correctly, there are other considerations. Every browser runs on a single main thread. That thread renders the page, responds to user clicks, executes JavaScript, plays animations – all of that fun stuff.
But when too much happens at once, the browser can’t keep up. Scrolling stutters. Clicks don’t register right away. The page feels heavy and unresponsive. This slowdown happens when all those different actions compete for that single thread. You overwhelm the browser.
When you see “long main-thread tasks” flagged in GTmetrix, this is what it’s pointing to. Users don’t think in terms of threads or execution time because that’s not how people experience websites. They just know the site feels slow, and GTmetrix can help you spot the reasons why.
CDNs Are Helpful but Not a Cure-All
We’ve covered what happens when the browser processes your site. But GTmetrix also measures how long it takes for files to reach the browser in the first place.
A big factor is how far those files have to travel. A CDN, or Content Delivery Network, stores copies of your site’s files on servers around the world. Someone in Tokyo doesn’t need to wait for files to travel from a server in Atlanta. They get a faster response from a closer location, which reduces latency and load times with images, JavaScript, CSS, and fonts.
A CDN is part and parcel with high-quality web hosting these days. Our web hosting services include this because every nano-second factors into your broader site performance.
That being said, a CDN doesn’t fix shaky site architecture. If your site ships massive files or overwhelms the browser during page load, a CDN just delivers those problems faster. The best results come when you fix the heaviness first, then let a CDN help with speeding up delivery.
What Fast Sites Have in Common
There’s a familiar pattern when you look at slow GTmetrix reports. Too much is being loaded, Javascript is trying to do too much, and the browser is getting overwhelmed.
While you don’t necessarily need to chase high GTmetrix scores, there is a lot GTmetrix can shine a light on to keep your site running smoothly. The fastest sites focus on lean code, fewer plugins, smaller file sizes, and optimized assets. Everything serves a specific purpose or it doesn’t make it onto the site.
That’s why GTmetrix is valuable. Not because it gives you a be-all-end-all grade, but because it shows you where the weight is hiding. And where to start fixing for a faster site.
High Grades Isn’t the Goal. A Faster Site Is.
I realize this is a lot of technical jargon. The takeaway isn’t that you need to understand every GTmetrix warning or become an expert in browser behavior. Site speed is usually the result of many small, intentional decisions adding up over time.
Speed is a cornerstone for all of our client sites. We’ve cut load times in half for some clients and improved others by 10-15% without needing a total rebuild. That kind of improvement doesn’t just make users happier, but rubs off on SEO, engagement, and conversions down the line.
Speed isn’t everything, but it’s a big thing for users, search engines, and even AI chatbots. If you want to see how you’re doing, run a free GTmetrix test on your own site. And if you’d rather not untangle these issues yourself, feel free to reach out to us.