
We Ran 150 Speed Tests on Our Own Website. Here's What Makes a Site Fast.

We talk to clients about website speed all the time. Speed affects how long people stay, whether they fill out your form, and how Google ranks you. But talk is cheap, so we decided to put our own website on the line.
We took our own website and built it two ways. One version is our current WordPress site. The other is a rebuild with the same pages and the same content, built on Astro, a modern framework that turns a website into lightweight, prebuilt pages. Then we put those builds on five different hosts and tested them side by side: 150 Lighthouse runs, every page on the site, and over a thousand requests from test servers around the world.
The short version: the rebuilt site was dramatically faster, on every host we tried. And the reasons it was faster are things we can do for your site too.
The results at a glance
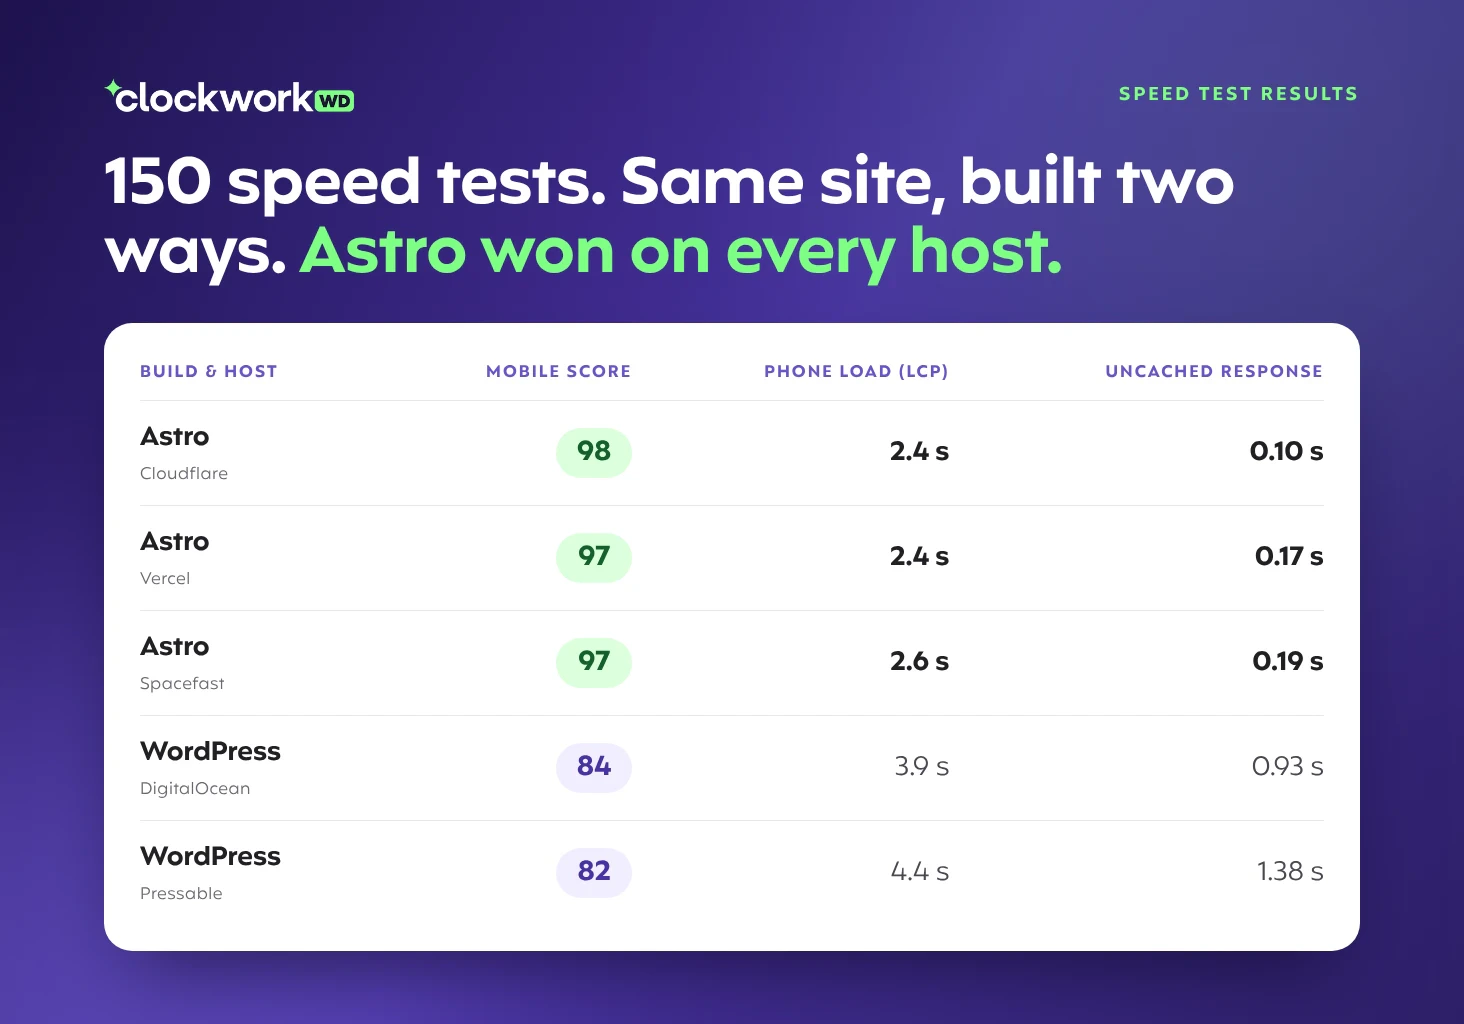
- Mobile Lighthouse score: 97 to 98 for the Astro build, 82 to 84 for WordPress.
- Time to show the main content on a phone: about 2.4 seconds for Astro, 3.9 to 4.4 seconds for WordPress.
- Data per page: about 365 KB for Astro, about 1.6 MB for WordPress. That's roughly a quarter of the weight.
- Files per page: 28 for Astro, 87 for WordPress.
- Worst-case server response: under 0.2 seconds for Astro, up to 1.5 seconds for WordPress.
What We Tested
We wanted a fair fight, so we kept as much the same as we could.
- Two builds of the same website. The WordPress versions were identical copies of our current site, built with Elementor and the usual plugins. The Astro versions were rebuilds that look and read almost exactly the same, with the same content, the same 149 pages and the same URLs. The difference is what's under the hood.
- Five hosts. We ran the Astro build on Cloudflare, Spacefast and Vercel. We ran the WordPress site on a DigitalOcean server behind Cloudflare, and on Pressable, a managed WordPress host.
- Five kinds of test. Google Lighthouse on five key pages, a sweep of all 149 pages, detailed timing from our office in Atlanta, response times from 54 cities around the world, and a check of each host's settings.
The full testing method (for the curious)
Lighthouse. Lighthouse is Google's own testing tool, and it's what GTmetrix and PageSpeed Insights use under the hood. We ran it on five pages that represent the site well: the home page, the About page, a blog post with lots of animation, a case study full of portfolio images, and one of our audit landing pages with a form. Each page ran three times on a simulated phone over a slow 4G connection and three times on desktop, on every host. That's 30 runs per host and 150 in total. We report the middle (median) result so one lucky or unlucky run doesn't skew anything.
Every page on the site. For all 149 pages in the sitemap, we measured how long each host took to start sending the page (called time to first byte). We did it twice per page: the first request, which often hits an empty cache, and a second request right after, which shows the cached speed.
Timing from Atlanta. We sent 150 requests to each host from our office and split each one into its parts: looking up the address, connecting, setting up encryption, and waiting for the server. This shows where the time actually goes.
Worldwide. Independent test servers in 54 cities requested the home and About pages from each host, three rounds each.
Fairness. Every Astro host served the exact same files from the same build, with the same redirects and caching rules. All five tests ran from the same machine and connection on the same evening. The test copies were hidden from search engines so they didn't compete with our real site.
Result 1: Lighthouse Scores
Lighthouse scores a page from 0 to 100 on performance. On mobile, which is the tougher test, the Astro build scored in the high 90s on every host. WordPress landed in the low 80s.
| Mobile Lighthouse (median) | Score |
|---|---|
| Astro on Cloudflare | 98 |
| Astro on Spacefast | 97 |
| Astro on Vercel | 97 |
| WordPress on DigitalOcean | 84 |
| WordPress on Pressable | 82 |
On desktop, where Lighthouse doesn't slow the connection down, the gap shrinks. Astro scored a perfect 100 on every host and WordPress scored 98 to 99. Desktop is forgiving. Phones are where a heavy site shows its weight, and that's where most of your visitors are.
The Astro build also scored higher on accessibility, 99 against 92.
Scores page by page
| Page (mobile score) | Astro range | WordPress range |
|---|---|---|
| Home | 93 to 94 | 86 to 89 |
| About | 98 to 99 | 59 to 68 |
| Blog post | 97 to 98 | 94 |
| Case study | 97 | 82 to 83 |
| Audit landing page | 99 to 100 | 79 to 84 |
The About page shows the biggest gap. The WordPress version downloads 87 files (about 1.6 MB), while the Astro version downloads 36 (about 670 KB). The blog post was the closest, because it's mostly text.
Result 2: How Long a Phone Waits to See the Page
The number that matters most to a real person is how long they stare at a blank or half-loaded screen. Lighthouse measures this as Largest Contentful Paint (LCP): the moment the biggest thing on the screen, usually a headline or hero image, shows up. Google considers under 2.5 seconds good and over 4 seconds poor.
| Largest Contentful Paint, mobile (median) | Time |
|---|---|
| Astro on Cloudflare | 2.4 seconds |
| Astro on Vercel | 2.4 seconds |
| Astro on Spacefast | 2.6 seconds |
| WordPress on DigitalOcean | 3.9 seconds |
| WordPress on Pressable | 4.4 seconds |
On a phone, the Astro build showed its main content about 1.4 to 2 seconds sooner. Several WordPress pages crossed the 4-second line Google calls poor, and the slowest (the About page) took close to 6 seconds.
What slows the first paint down
On the WordPress site, the biggest thing on the home page is a large hero image of three phones. The browser has to download it before the page counts as loaded, and it's competing with dozens of scripts and stylesheets for bandwidth.
On the Astro site, the biggest thing is the hero text, which doesn't need a download at all. It still waits on a fade-in animation, which is why the Astro home page sits around 3 seconds while its other pages are closer to 2. That's on our to-do list: show the text right away and let the animation be decoration rather than a gate.
Neither site had any "blocking time" (scripts freezing the page) or layout shift (things jumping around as the page loads). Both are clean there.
Result 3: The Astro Site Ships a Quarter of the Data
This is the real reason for everything above. Every file a page asks for is another trip across the internet, and every kilobyte is more for a phone to download and process.
| Per page (median, mobile) | Astro | WordPress |
|---|---|---|
| Data downloaded | about 365 KB | about 1.6 MB |
| Files requested | 28 | 87 to 88 |
The home page shows it most clearly:
| Home page | Astro | WordPress |
|---|---|---|
| Total | 45 files, about 710 KB | 107 files, about 2.3 MB |
| JavaScript | 14 files, 124 KB | 33 files, about 710 KB |
| Stylesheets | 2 files, 13 KB | 26 files, about 56 KB |
| Images | 24 files, about 460 KB | 34 files, about 1.4 MB |
| Third-party requests | 0 | 14, about 375 KB |
Where does all that WordPress weight come from?
Nothing on our WordPress site is unusual. It's a well-maintained, professionally built site. The weight comes from how page builders and plugins work.
- Page builder code. Page builders like Elementor load a lot of their own scripts and stylesheets so any widget can work on any page. On our home page that added up to 33 scripts and 26 stylesheets.
- Plugins. Each plugin that touches the front end (forms, SEO, analytics, sliders) tends to bring its own files.
- Images. WordPress serves good images, but the rebuild let us size every image for exactly where it appears, in modern formats.
- Third parties. Analytics and other services add requests to outside servers. To be fair to WordPress, the Astro test copies didn't have analytics switched on yet. That will add a little weight back when the new site launches, but nothing close to the gap you see here.
Result 4: Server Speed and Why Caching Matters
When you visit a page, the server has to start sending it. We measured how long that took from our office in Atlanta, in two situations: a page the host already had cached, and one it had to fetch or build from scratch.
| Server response from Atlanta (median) | Cached page | Uncached page |
|---|---|---|
| Astro on Cloudflare | 112 ms | 104 ms |
| Astro on Spacefast | 48 ms | 193 ms |
| Astro on Vercel | 111 ms | 170 ms |
| WordPress on DigitalOcean | 142 ms | 933 ms |
| WordPress on Pressable | 37 ms | 1,376 ms |
(A millisecond is a thousandth of a second, so 1,000 ms is one full second.)
When a page is cached, every host is quick, and Pressable was actually the fastest of all. The difference is what happens when the page isn't cached. An Astro site is made of prebuilt pages, so there's nothing to build, and even uncached pages came back in under a fifth of a second at the median. A WordPress page has to be built by the server on the spot, running PHP and querying the database, and that took one to one and a half seconds.
How often does a visitor hit an uncached page?
More often than you'd think. Caches don't keep pages forever. One of the WordPress hosts we tested keeps a cached page for 5 minutes. If nobody has visited a page in the last 5 minutes, the next visitor waits for WordPress to build it.
For a busy home page that's rarely a problem. For the other 140-plus pages on a typical business site (service pages, blog posts, case studies) it happens all the time, because those pages don't get a visitor every few minutes. Those are often the pages people find through Google, which makes them the worst pages to be slow.
A prebuilt site doesn't have this problem. Every page is ready before anyone asks for it.
Result 5: Every Page on the Site
Testing five pages is useful, but we wanted to see the whole site. So we requested all 149 pages on every host, twice each.
| All 149 pages | First visit (median) | Second visit (median) | Pages over 0.3 s on first visit |
|---|---|---|---|
| Astro on Cloudflare | 217 ms | 95 ms | 15 |
| Astro on Spacefast | 149 ms | 45 ms | 5 |
| Astro on Vercel | 176 ms | 103 ms | 4 |
| WordPress on DigitalOcean | 144 ms | 129 ms | 26 |
| WordPress on Pressable | 1,509 ms | 43 ms | 148 |
The two WordPress results show the two sides of caching. Our live WordPress site gets real traffic, so most of its pages were already sitting in its cache and the typical first visit was quick. Even so, 26 pages had dropped out of the cache and took longer, with the slowest at 1.4 seconds. The other WordPress copy had a freshly cleared cache, which shows what an empty cache really costs: almost every page took over a second, with a median of 1.5 seconds. Once cached, it was the fastest of all.
The Astro hosts never build pages on request, so their first visits all stayed in a tight range.
Does the host matter?
Some, but much less than how the site is built. The three Astro hosts scored within a point of each other in Lighthouse, and the run-to-run variation on any one host was bigger than the gap between hosts.
Where hosts did differ was raw network speed, depending on where the visitor is. These are mostly cached-page times from independent test servers.
| Median response by region | Cloudflare | Spacefast | Vercel | Pressable |
|---|---|---|---|---|
| North America | 165 ms | 87 ms | 110 ms | 84 ms |
| Europe | 99 ms | 133 ms | 152 ms | 157 ms |
| Asia | 129 ms | 301 ms | 166 ms | 343 ms |
For a business with customers in the US, the hosts with strong North American networks came out ahead. For a global audience, Cloudflare's network spread shows. We couldn't include our live WordPress server in this test, because its security settings blocked the test servers.
Notes on each host
- Cloudflare. The best worldwide numbers, modern HTTP/3 support, and the most consistent response whether a page was cached or not. In our tests it was the slowest of the hosts we could measure in the US.
- Spacefast. The fastest Astro host from Atlanta and across North America. It adds a small script of its own to every page, which is worth knowing about.
- Vercel. Middle of the pack everywhere, with excellent tools for developers: previews for every change, automatic deploys and built-in serverless functions for things like forms.
- Pressable. The fastest host in our tests when a page was cached. Uncached WordPress pages were slow, but that's WordPress building the page, not the host.
- DigitalOcean. A general-purpose server running WordPress behind Cloudflare. Solid cached performance, with the same uncached slowdown.
What Actually Makes a Website Fast
None of this is magic. The rebuild was faster for a handful of reasons, and most of them apply to any site, WordPress included.
- Send less stuff. The fastest file is the one you never load. Every script, stylesheet, font and plugin has to earn its place.
- Prebuild what you can. Pages that are ready before anyone asks for them never make a visitor wait on a server.
- Size images for where they appear. A 1,280-pixel image in a 400-pixel slot is wasted download. Modern formats like WebP and AVIF help a lot. (We wrote more about this in How to Size and Compress Images.)
- Cache smartly. If you're on WordPress, how long pages stay cached matters as much as whether they're cached at all.
- Be careful with third parties. Chat widgets, trackers and embeds each add requests to someone else's servers.
- Don't make content wait on animation. Motion is nice. Making the headline wait for it isn't.
- Measure everything. We test with Lighthouse and GTmetrix, across the whole site, not just the home page.
Does this mean WordPress is slow?
No. WordPress powers a huge share of the web, we build and support WordPress sites every day, and a well-tuned WordPress site can be quick. Our own WordPress site scored 98 to 99 on desktop.
What this test shows is that the extra layers most WordPress sites carry (a page builder, a stack of plugins, and pages built on request) cost real speed on phones. You can remove a lot of that cost on WordPress with careful theme work, fewer plugins, better images and smarter caching. We covered some of the basics in How to Speed Up Your WordPress Site.
When speed is the top priority, or a site is mostly content that doesn't change minute to minute, a prebuilt site like Astro removes that cost entirely. That's why we've been adding Astro to our toolkit.
Will a faster site actually help my business?
Speed isn't a vanity number. Visitors leave slow pages, especially on phones, and Google uses page experience (including Largest Contentful Paint) as part of how it ranks pages. A page that shows up in 2.4 seconds instead of 4.4 gives a visitor two fewer seconds to hit the back button.
It also compounds. A faster site is cheaper to serve, holds up better when traffic spikes, and makes every other investment (ads, SEO, content) work a little harder.
Is switching to Astro a big project?
It depends on the site. A content site like ours is a good fit: pages, blog posts, case studies and forms. A site with heavy e-commerce or lots of logged-in features may be better served by speeding up WordPress instead. Part of what we do is tell you which path makes sense, and we'll be honest when the answer is "keep WordPress and tune it."
Want a website that's screaming fast?
We know how to make a site fast, and now we have the numbers to prove it. Whether that means rebuilding on Astro or squeezing every millisecond out of your current WordPress site, we'll measure it, fix it and show you the before and after.
Let's talk about your site's speed, or start with a free website audit and we'll show you what's slowing it down.


